Summary
Both NYSE: KO and NASDAQ:PEP are very strong defensive companies for long term investors.
NYSE: KO has a higher profit margin and lesser capital requirement for growth.
Both stocks have returned well although their net income remains constant during the last ten years.
NYSE: KO’s advantage is a higher profit margin while NASDAQ:PEP has a more diversified portfolio. Their valuations are almost at the same level.
Their current multiples are higher than their historical averages, so I believe that current price levels are suitable for only long-term investors who make gradual periodic investments over a long period of time.
Company Information
NYSE: KO is one of the great firms in terms of long term competitive advantage and its strengths include (1) extensive distribution channels in all around the world including more than 200 countries; (2) best in class portfolio in total nonalcoholic ready-to-drink market, including four of worlds’ top five nonalcoholic sparkling beverage brands; and (3) continuous growth of demand of its products.
KO reach its customers more than any other brand as shown by the below graph.
Graph 1
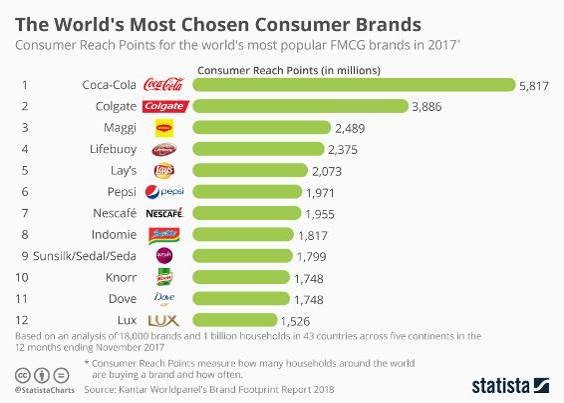
Source: Statista
NYSE: KO recently completed bottling operations transformation process. Bottling operations are difficult to manage, require extensive investment and have a low-profit margin. So, KO decided refranchising bottling system in North America nearly a decade ago and completed the transformation in 2017. Another important step in 2017 was the sale of bottling businesses in China. After this transformation, KO is planning to focus on its core business of building strong brands as shown in Graph 2
Graph 2-
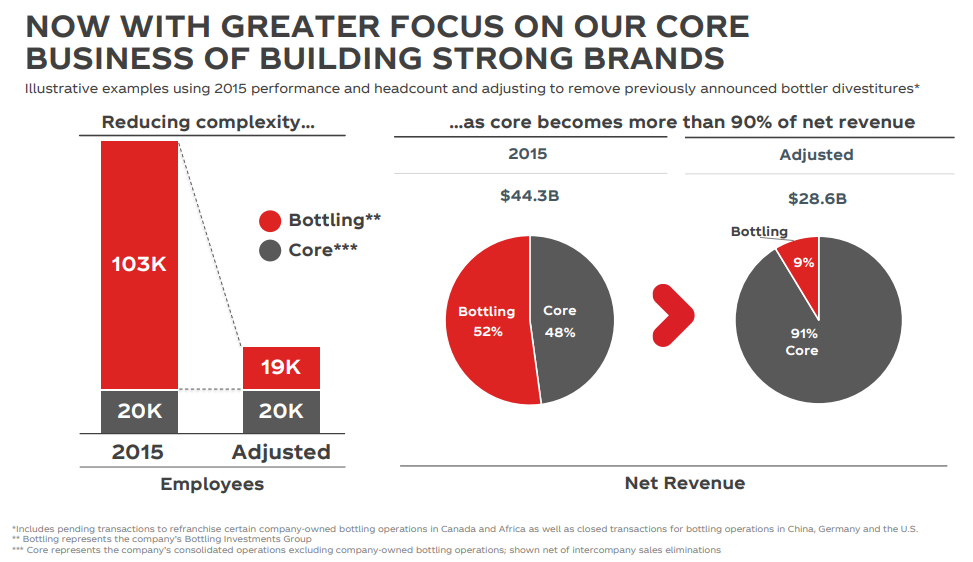
Source: Company Presentation
NASDAQ:PEP has a similarly strong position in the nonalcoholic ready-to-drink market. PEP also operating in the snack foods market with its strong brands including Lays, Doritos, Tostitos, Cheetos, Quaker Oats, and others. Combination of a wide range of products which are using the same distribution channel constitutes a great long term competitive advantage for PEP.
In 2018, PEP’s organic revenue grew by 3.7%, PEP generated a free cash flow of $7.6 billion and increased its dividend for the 46th consecutive year.
Industry
The nonalcoholic beverage industry is one of the fastest growing industries all around the world. As can be seen in graph 3, there is a clear upward trend in the growth of the industry. The annual sales revenue of the global nonalcoholic beverage market was nearly $1 trillion in 2016. CAGR of the market is estimated to be 5.8% till 2025.
Graph 3- Nonalcoholic beverage market value in the US by product category (in billion U.S. dollars)
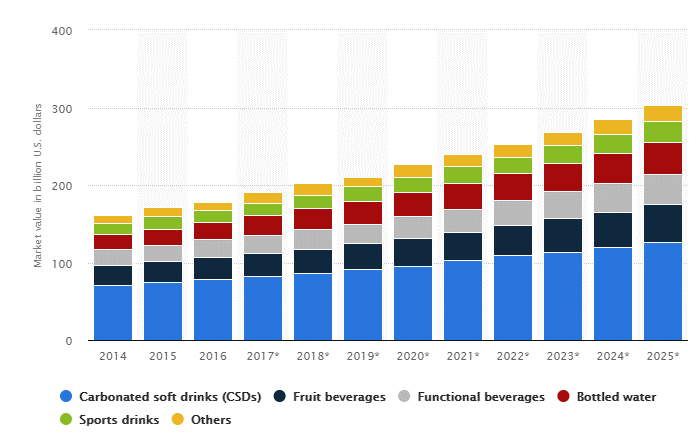
Source: Statista
The major challenge of the industry is health and convenience related concerns. Some of the ingredients including sugar and acids that are used in most of the nonalcoholic beverage products cause diseases such as obesity and diabetes. These concerns limit the growth rate of the industry.
The main drivers which support the growth of the industry are the urbanization trend, increase in the population and increase of the purchasing power of the people living in the developing countries.
2019 first Quarter Results
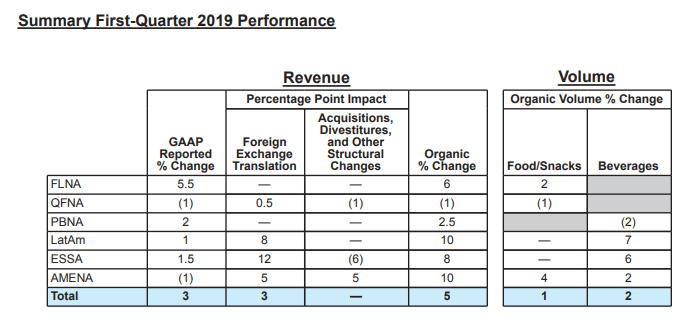
NYSE: KO announced its first quarter financial results on April 23, 2019. Net revenues grew 8% to $8 billion in the quarter. Operating margin of the company in the first quarter of 2019 is 29.1% in comparison with 23.7% in the previous year. The sales volume in Latin America, North America has been decreased by 3% but Europe, Middle East & Africa region has been increased by 4% and Asia Pacific region has been increased by 6%. According to the company’s recent estimates in 1. quarter earnings report, growth of organic revenues is estimated to be 4% and EPS from the continuing operation is estimated to remain flat at $2.08 in 2019.
Table 1- COKE’s Summary of First-Quarter 2019 Performance
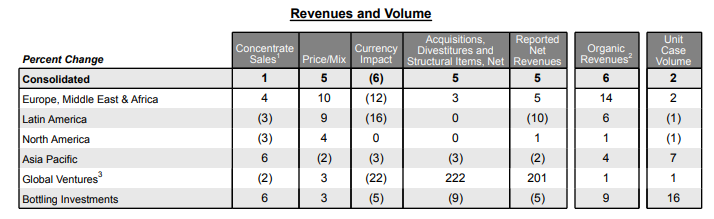
Source: NYSE: KO’s Q1 Earnings Release
NASDAQ:PEP announced its first quarter 2019 financial results on April 17, 2019. PEP’s organic revenue growth and EPS growth were 5.2% and 6% respectively, in the first quarter of 2019. According to the company’s recent estimates in 1. quarter earnings report, the growth of organic revenues is estimated to be 4% in 2019. Company is also planning to return total cash of approximately $8 billion, comprised of dividends of approximately $5 billion and share repurchases of approximately $3 billion, to shareholders in 2019.
Table 2- PEPSI’s Summary of First-Quarter 2019 Performance
Source: PEP’s Q1 Earnings Release
Comparison of financials
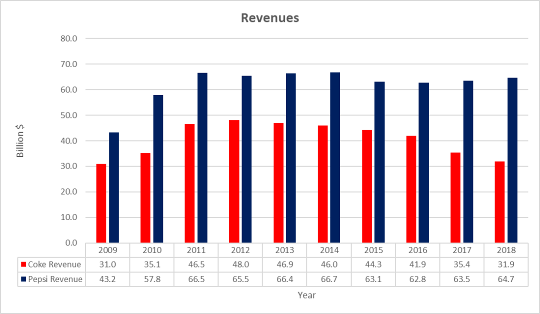
During the last eight years, PEPSI has achieved to sustain its revenues at around $65 billion. There is a downward trend in revenues of KO because of refranchising of its bottling system. Compound annual growth of revenues of KO is -7.4% vs. PEPSI’s growth rate of -0.5% in the last five years. Because of refranchising activities in North America, China, Germany and Africa net revenues of KO has been reduced to $31.8B in 2018 from $44.2 in 2015 but the operating margin has been increased by 760 bps and reached 30.8% in 2018. In 2018 KO is achieved to increase its organic revenue by 5% and operating income by 11%.
Graph 4- Revenues of COKE and PEPSI
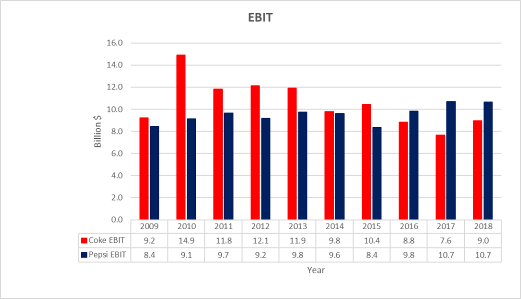
I believe that amortization and depreciation are the cost of doing businesses and both companies have steady businesses, so I compared EBIT instead of EBITDA. In the EBIT comparison of these two companies in the last ten years, PEPSI is better performer again. PEPSI is achieved to increase its EBIT by 1.8% annually during the last five years. However, EBIT of KO contracted 5.5% on average annually during the same period.
Graph 5- EBITs of COKE and PEPSI
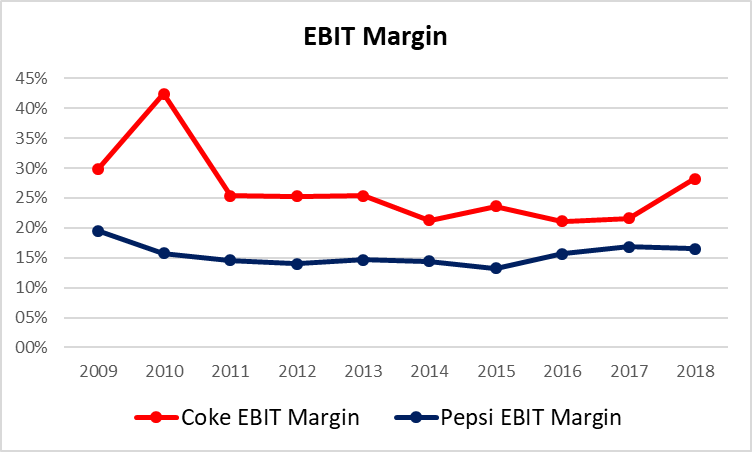
We see different trends in EBIT margins. In 2018, KO has an EBIT margin of 28.2% in comparison with 21.6% in 2017. PEPSI has an EBIT margin of 10.7% which remain constant during the last two years.
Graph 6- EBIT Margins of COKE and PEPSI
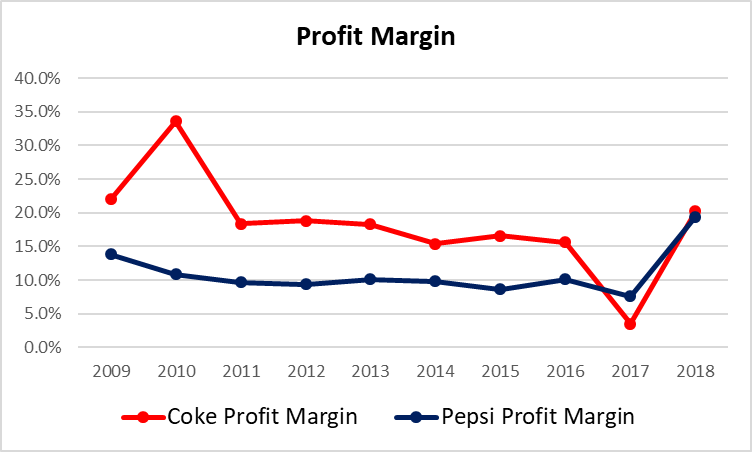
NYSE: KO has a higher profit margin of %18.2 on average during the last ten years. In 2018 the net tax benefits of $5.3 billion related to TJC act has been included in PEP’s financials. So, we see a one-off increase in its profit margin in 2018. PEP’s average profit margin during the last ten years is 10.9%. KO’s refranchising of bottling operations helped KO to increase its profit margin in 2018.
Graph 7- Profit Margins of COKE and PEPSI
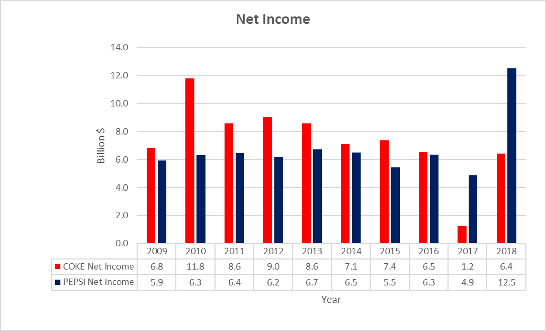
When we compare the net income of NYSE: KO and PEPSI during the last ten years we see similar stats except 2017 and 2018. Poor net income performance of KO in 2017 includes deferred tax balances and the one-time transition tax resulting from the Tax Cuts and Jobs Act that was signed into law on December 22, 2017. Another important point is that the net income of KO is higher than PEP although KO’s revenues are lower than PEP, because of the higher profit margin.
Graph 8- Net Incomes of COKE and PEPSI
Capital Structure
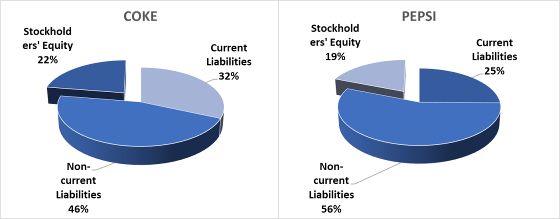
NYSE: KO and NASDAQ:PEP have similar capital structures. KO’s and PEPSI’s equity ratios (equity coverage of total assets) are 22% and 19%, respectively, at the end of the first quarter of 2019.
Graph 9- Capital Structures of COKE and PEPSI at the end of the first quarter of 2019
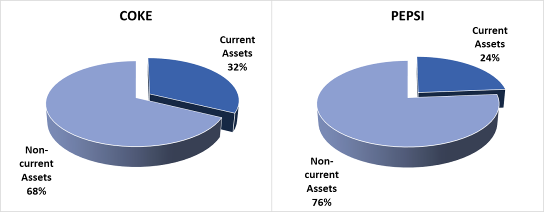
When we compare NYSE: KO’s and NASDAQ:PEP’s asset structures we see that PEPSI has more non-current assets. Property Plant and Equipment constitutes PEP’s $19 billion of $75.5 billion total assets (%25.1) and KO’s $10.2 billion of $88.4 billion total assets (%11.5). So PEP’s operations require much more capital in comparison with KO’s current structure.
Graph 10- Assets Structures of COKE and PEPSI at the end of the first quarter of 2019
Stock Price Performance
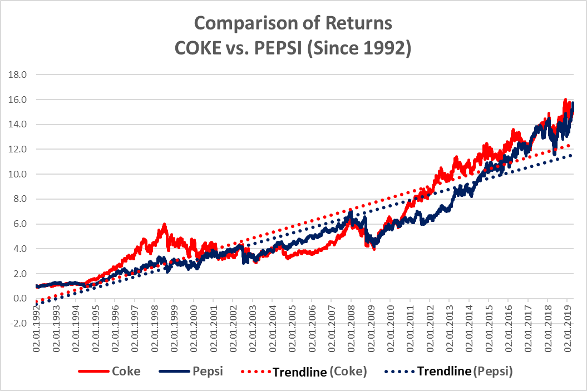
NYSE: KO stock price has been appreciating steadily during the last ten years with an annual return of %12.2 vs. net income growth rate of 0.3% during the same period.
Graph 11- Comparison of Returns of COKE and PEPSI
Valuation
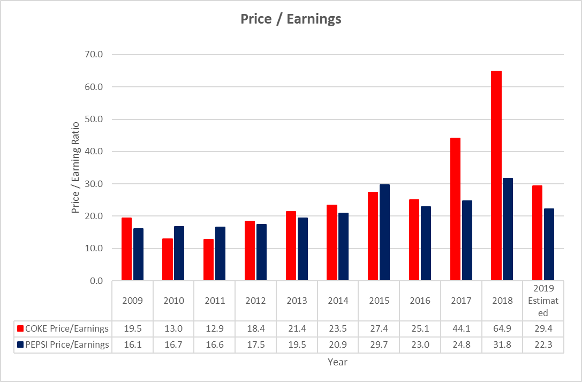
NYSE: KO is currently trading with market cap of $206 billion, PE ratio of 29.4, dividend yield of 3.2% and forward dividend yield of 3.4%. KO’s payout ratio is 0.96. PEP is trading market cap of $177 billion, PE ratio of 22.3, dividend yield of 2.9% and forward dividend yield of 3.7%. KO and PEP’s Price / Earnings ratios during the last 10 years are shown in Graph 12. PEP’s one-off tax benefit needs to be considered in
Graph 12 – Development of Price / Earnings Ratio of COKE and PEPSI
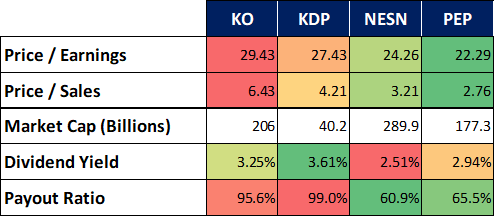
Below table shows KO, NASDAQ:PEP and their competitors’ key ratios.
Table 3 – Key Ratios of Competitors
Conclusion
I believe that both NYSE: KO and NASDAQ:PEP are good defensive investments in the long term. However, their current valuation of around 3% dividend yield and 4% EPS growth estimates do not represent a bargain. I believe that current price levels are suitable for only long-term investors who make gradual periodic investments over a long period of time.
See list of the top NYSE: KO investors
See top insider transactions of NASDAQ: PEP